EX-99.1
Published on September 17, 2015

Introduction to Investors
September 2015 Exhibit 99.1 |

1 Notices and Disclaimers Copyright © 2015, PJT Partners Inc. (and its affiliates, as applicable).
This
presentation
contains
forward-looking
statements,
including
those
about
PJT
Partners
Inc.s
(the
Company)
outlook
and
prospects,
within
the
meaning
of
the
Private
Securities
Litigation
Reform
Act
of
1995.
Forward-looking
statements
are
those
which
are
not
historical
facts.
These
and
other
statements
that
relate
to
future
results
and
events
are
based
on
the
Companys
current
expectations
as
of
September
2,
2015.
Our actual results in future periods may differ materially from those currently expected because of a number of risks and uncertainties. The risks and uncertainties that we believe are material are described in the Risk Factors section of the Information Statement that is an exhibit to PJT Partners Registration Statement on Form 10, which was filed with the Securities and Exchange Commission dated September 2, 2015, SEC File No. 001-36869. Please consult these documents for a more complete understanding of these risks and uncertainties. We disclaim any intention or obligation to update or revise any forward-looking statements, whether as a result of new information, future events or otherwise, except as may be required by law. Our outlook is provided for the purpose of providing information about our current expectations for 2015 and the general outlook for the business in the longer term. This information may not be appropriate for other purposes. This presentation contains certain non-GAAP financial measures. A non-GAAP financial measure is defined as a numerical measure of a companys financial performance that excludes or includes amounts so as to be different than the most directly comparable measure calculated and presented in accordance with generally accepted accounting principles in the United States of America (GAAP) in the statements of operations, financial condition or statements of cash flow of the company. The Company has provided a reconciliation of Adjusted Pre-Tax Income, a non-GAAP financial measure, to GAAP Income (Loss) Before Provision for Taxes in the Appendix to this presentation. Adjusted Pre-Tax Income is presented because management believes that such a financial measure, when viewed with the Companys results of operations in accordance with GAAP and the reconciliation of Adjusted Pre-Tax Income to Income (Loss) Before Provision for Taxes, provides additional information to investors about certain transaction-related charges arising from the spin-off related transactions. You should not consider Adjusted Pre-Tax Income in isolation, or as a substitute for analysis of results as reported under GAAP. Our calculation of Adjusted Pre-Tax Income may not be comparable to that reported by other companies. For additional information about our non-GAAP financial measures, see our filings with the Securities and Exchange Commission. This document is as is and is based, in part, on information obtained from other sources. Our use of such information does not imply that we have independently verified or necessarily agree with any of such information, and we have assumed and relied upon the accuracy and completeness of such information for purposes of this document. Neither we nor any of our affiliates or agents, make any representation or warranty, express or implied, in relation to the accuracy or completeness of the information contained in this document or any oral information provided in connection herewith, or any data it generates and expressly disclaim any and all liability (whether direct or indirect, in contract, tort or otherwise) in relation to any of such information or any errors or omissions therein. Any views or terms contained herein are preliminary, and are based on financial, economic, market and other conditions prevailing as of the date of this document and are subject to change. We undertake no obligations or responsibility to update any of the information contained in this document. Past performance does not guarantee or predict future performance. This document does not constitute an offer to sell or the solicitation of an offer to buy any security, nor does it constitute an offer or commitment to lend, syndicate or arrange a financing, underwrite or purchase or act as an agent or advisor or in any other capacity with respect to any transaction, or commit capital, or to participate in any trading strategies, and does not constitute legal, regulatory, accounting or tax advice to the recipient. This document does not constitute and should not be considered as any form of financial opinion or recommendation by us or any of our affiliates. This document is not a research report nor should it be construed as such. This document may include information from the S&P Capital IQ Platform Service. Such information is subject to the following: Copyright © 2015, S&P Capital IQ (and its affiliates, as applicable). This may contain information obtained from third parties, including ratings from credit ratings agencies such as Standard & Poors. Reproduction and distribution of third party content in any form is prohibited except with the prior written permission of the related third party. Third party content providers do not guarantee the accuracy, completeness, timeliness or availability of any information, including ratings, and are not responsible for any errors or omissions (negligent or otherwise), regardless of the cause, or for the results obtained from the use of such content. THIRD PARTY CONTENT PROVIDERS GIVE NO EXPRESS OR IMPLIED WARRANTIES, INCLUDING, BUT NOT LIMITED TO, ANY WARRANTIES OF MERCHANTABILITY OR FITNESS FOR A PARTICULAR PURPOSE OR USE. THIRD PARTY CONTENT PROVIDERS SHALL NOT BE LIABLE FOR ANY DIRECT, INDIRECT, INCIDENTAL, EXEMPLARY, COMPENSATORY, PUNITIVE, SPECIAL OR CONSEQUENTIAL DAMAGES, COSTS, EXPENSES, LEGAL FEES, OR LOSSES (INCLUDING LOST INCOME OR PROFITS AND OPPORTUNITY COSTS OR LOSSES CAUSED BY NEGLIGENCE) IN CONNECTION WITH ANY USE OF THEIR CONTENT, INCLUDING RATINGS. Credit ratings are statements of opinions and are not statements of fact or recommendations to purchase, hold or sell securities. They do not address the suitability of securities or the suitability of securities for investment purposes, and should not be relied on as investment advice. All facts, metrics and other information provided herein are presented as of 9/11/15 unless otherwise stated. Presentation of Information Non-GAAP Financial Measures Forward-Looking Statements |

2 Transaction Summary TRANSACTION Blackstone Advisory merges with PJT Capital followed by spin-off
PUBLIC COMPANY PJT Partners Inc. DISTRIBUTED SECURITY Class A Common Stock EXCHANGE NYSE TICKER PJT DISTRIBUTION RATIO 1:40 INITIAL FLOAT 15.4 million RECORD DATE September 22, 2015 WHEN-ISSUED DATE September 18, 2015 TRADING DATE October 1, 2015 |

Todays Presenters
Ji-Yeun Lee MANAGING PARTNER Helen Meates CHIEF FINANCIAL OFFICER Paul J. Taubman CHAIRMAN & CEO 3 |

4 We Are PJT Partners |

5 We Are Frequently Asked
Why this transaction? > Two anchor businesses alpha play on advisory World-class fund placement and restructuring businesses Proven ability to build premier advisory business > Creating a best-in-class platform to better serve clients
Why go public now? > Beginning the journey now Not raising capital Not seeking liquidity > Accelerant for growth and unlocking value |

Unshackled from Constraints to Be Even More Powerful
STRATEGIC ADVISORY RESTRUCTURING & SPECIAL SITUATIONS PARK HILL Financial Sponsors Investing Businesses within Blackstone Corporate Clients X X X X X HISTORICAL CONSTRAINTS X X 6 |

Bringing
Together Relationships and Capabilities to Better Serve
Clients Strategic
Advisory Park Hill Restructuring Access Relationships Transaction Flows Capital 7 |

30 Years
New: A Start-Up With Instant Scale 8 offices
Headquartered in New York, NY
46 partners 37 Americas, 9 Europe ~330 employees 235 Americas, 83 Europe, 10 Asia-Pacific 24 years Average partner experience 8 |

Create
long-term value Make a difference
Be part of a premier franchise
Be surrounded by leading talent
Client relationships Collaboration Premier Destination for Best-in-Class Talent WHAT WE OFFER WHAT WE VALUE Alpha players with: Content Character 9 |

Proven
Management Team: Ability to Scale Name
Role Years of Experience Former Position Executive Officers Paul J. Taubman Chairman & CEO 33 Co-President of Institutional Securities at Morgan Stanley Ji-Yeun Lee Managing Partner 26 Deputy Head of Global Investment Banking at Morgan Stanley Helen Meates Chief Financial Officer 22 Deputy Head of Global Capital Markets at Morgan Stanley James Cuminale General Counsel 37 Chief Legal Officer at Nielsen Other Senior Management Paige Costigan Chief Operating Officer 15 CAO of Global Investment Banking at Morgan Stanley Sharon Pearson Head of Investor & External Relations 20 Associate Director of Equity Research at Morgan Stanley Richard Itri Chief Technology Officer 18 CIO at Sky Road Steven Murray Global Head of Human Resources 14 Global Head of Compensation at UBS Investment Bank CORPORATE TEAM 10 |

PJT
Partners Scorecard To Date
> Talent retention > Culture of collaboration > High quality hires Attracted to vision and platform > Built out public company infrastructure Board Management team Systems/controls Facilities 11 |

PJT
Partners Scorecard Going Forward
> Continue to attract talent > Realize benefits of demerger and collaboration > Franchise/brand building Mind share Win rate Announcements 12 |

A
Powerful Beginning Built to be an alpha play
> 30-years new: proven track record with start-up feel > Premier destination for best-in-class talent > Unshackled from constraints to better pursue opportunities > Bringing together relationships and capabilities to better serve clients 13 |

Park
Hill: The Leading Intermediary in the Alternative Asset Space
(1) Preqin Special Report: Private Equity Secondary Market. Mar. 2015. (2) Amount as of 6/30/15. 2005 Year established 84 Professionals in New York, Chicago, Hong Kong, London, San Francisco and Sydney 3,000+ Investor relationships 24 Average years of experience across 14 partners ~20% Market share of secondary transaction volume $260bn+ Raised by Park Hill clients since inception, representing 194 primary funds (2) (1) 14 |
Park
Hill: Leading Market Position in Each of the Principal Alternative Asset
Categories (1)
Represents clients served across multiple verticals.
Private Equity Hedge Fund Real Estate Secondary Advisory (1) (1) (1) (1) 15 |

Benefit from PJT Advisory Alignment > Leveraging advisory relationships > Portfolio monetization opportunities > Bespoke investment opportunities > Enhanced real estate capabilities/collaboration Build Out Existing Capabilities/Execute on Core Strengths > Continue to capture GP recapitalization opportunities > Lead in high-growth securitization space > Increase market share via specialist model > Expand breadth of products across all four verticals Park Hill: Growth Opportunities 16 |

Restructuring & Special Situations: Market Leadership in
Advising Distressed Companies
(1) As of 6/30/15. (2) Represents total liabilities restructured by professionals based in New York and London. Certain transactions were previously attributed to the advisory business. (3) Certain partners and professionals were previously considered part of the advisory business.
1991 Year established 60 Professionals based in New York and London (3) ~430 Distressed advisory situations (1) #1 Global completed and announced worldwide restructurings Thomson Reuters 2015 (1) 22 Average years of experience across 11 partners (3) ~$1.6 trillion Total liabilities restructured (1)(2) 17 |
OUT-OF-COURT ASSIGNMENTS
Restructuring & Special Situations: Global Reach
and Unmatched Expertise
IN-COURT ASSIGNMENTS
CREDITOR ASSIGNMENTS Completed Restructurings in More than 30 Countries 18 |

AUTOMOTIVE Restructuring & Special Situations: Significant Industry Expertise and Experience in Key Sectors Ford Motor Company General Motors Goodyear Tire & Rubber GAMING Caesars Entertainment Foxwoods Casino Mohegan Tribal Gaming CHEMICALS Dow Corning Specialty Products Holding W.R. Grace & Co. COAL New World Resources Patriot Coal Walter Energy COMMUNICATIONS Clearwire Lightsquared NII Holdings CONSUMER PRODUCTS CEDC Eastman Kodak Hostess Brands ENERGY & POWER Dynegy Edison Mission Energy Energy Future Holdings FINANCIAL SERVICES Ambac Financial Group MBIA re: Bank of America Northern Rock HEALTHCARE Angiotech Pharmaceuticals Four Seasons Health Care M*Modal LEISURE Indianapolis Downs Los Angeles Dodgers Travelport MANUFACTURING Covalent Materials Essar Steel Algoma NewPage MEDIA CSN Houston Relativity Media Tribune Company MUNICIPAL Detroit Jefferson County Puerto Rico OIL & GAS Endeavour International OGX Samson Resources PUBLISHING Cengage Learning Houghton Mifflin GateHouse Media REAL ESTATE Homex Kerzner International IVG Immobilien RETAIL Barneys New York BCBG Max Azria Group J.C. Penney SHIPPING Genco Shipping & Trading ZIM Integrated Shipping Nautilus Holdings SOVEREIGN Dubai World Greece Iceland TRANSPORTATION Delta Air Lines Hawker Beechcraft Pinnacle Airlines 19 |

Stronger M&A/Capital
Markets Advisory Presence > Enhanced M&A capabilities and industry expertise complement the skillset and business dynamics of Restructuring Ability to leverage strong industry expertise and relationships and deep market insights M&A and Capital Markets Advisory leadership provide differentiation vis-à-vis competitors > Advisory relationships facilitate earlier client introductions Expanded Sponsor Opportunities > Increases opportunities to expand PE relationships Sponsor owned businesses represent recurring revenue stream More opportunities to advise on distressed M&A transactions Eliminates reluctance to do business with a competitor Eliminates concerns about the optics of hiring Blackstone to assist with troubled investments Unencumbered > Eliminates conflicts with Blackstones hundreds of billions of credit, real estate and private equity investments/dry powder Passed on numerous substantial assignments due to conflicts (e.g. Lehman Brothers) > Creates opportunity to transform Blackstone/GSO relationships into a more traditional client/advisor relationship Restructuring & Special Situations: Growth Opportunities 20 |

Strategic Advisory: Transition and Transform
> Historically the most constrained of the three businesses Most significant dislocations Most significant growth opportunities > Exceeded expectations in ability to attract senior talent 13 new advisory partners added
and counting > 20% more advisory partners today than at time of spin/merge announcement > Intend to continue build-out of advisory team Focus on talent not organization chart 21 |

Strategic Advisory: Small Firm Feel with Big Firm Capabilities
10 Product Experts 5 Partners with 20+ years experience at previous firm 7 Regional Experts 7 Institutions Represented 13 Industry Experts 9 Partners with 10+ years experience at previous firm 18
and counting Partners 100% Former Group Heads/Senior Management Positions 22 |

An
Alpha Play on Advisory MACRO
> Continue to transform the Strategic Advisory business > Commercial impact of difference makers > Footprint expansion > Enhanced win rate through collaboration with other businesses > Established market demand for our services > Share/influence of smaller, more focused firms continues to grow > M&A as a corporate tool not going away EMBEDDED MACRO GROWTH FAVORABLE MACRO TRENDS + 23 |

Strong
Balance Sheet >
Debt-free at closing
Undrawn revolver of up to $80 million One-time build-out/start-up costs behind us > Ordinary course working capital > Deferred tax asset of $117 million (pro forma as of 6/30/15) 24 |

Fully-Diluted Shares Outstanding
(Shares in Millions) Note: Represents the composition of fully-diluted shares outstanding at the time of spin-off. Excludes an aggregate of
approximately 6.5 million shares deliverable on settlement of earn-out awards subject to time and performance-based vesting, as described in the Form 10.
(1) Represents shares owned by Blackstone insiders and PJT employees.
15.4 12.7 11.1 39.2 Initial Float Non-Float (Vested) PJT Employees (Unvested) Fully-Diluted Shares (1) 25 |
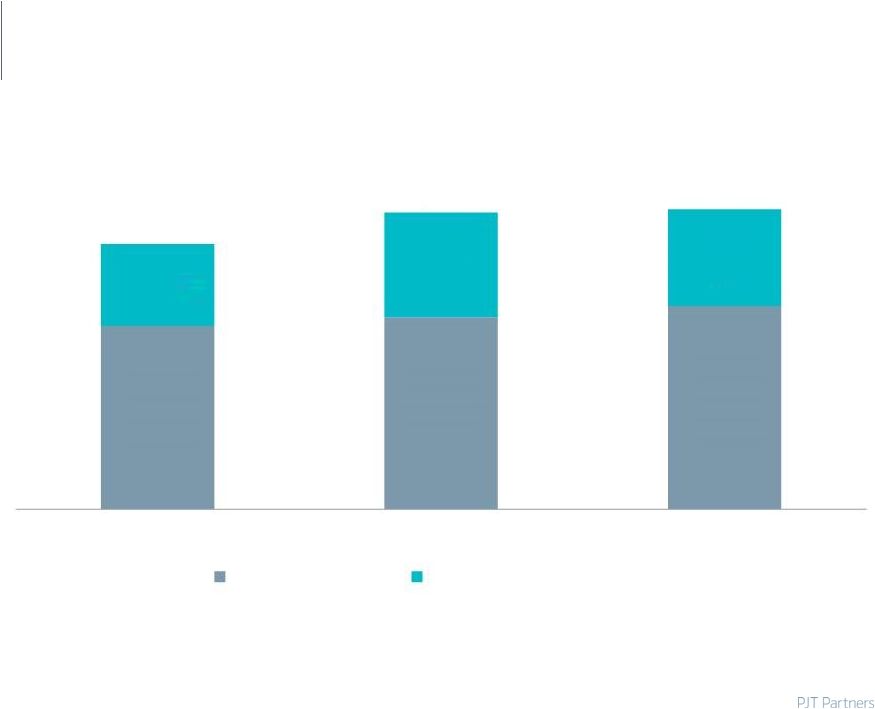
Historical Financials HISTORICAL REVENUE ($ in Millions) Note: Excludes historical PJT revenues. Totals may not add due to rounding. (1) Includes interest income and other revenue. (2) Average number of Partners/Senior Managing Directors in a corresponding year. (1) Partners (2) 38 38 38 244 256 271 110 141 130 $355 $397 $401 2012 2013 2014 Advisory Fees Placement Fees/ Other 26 |
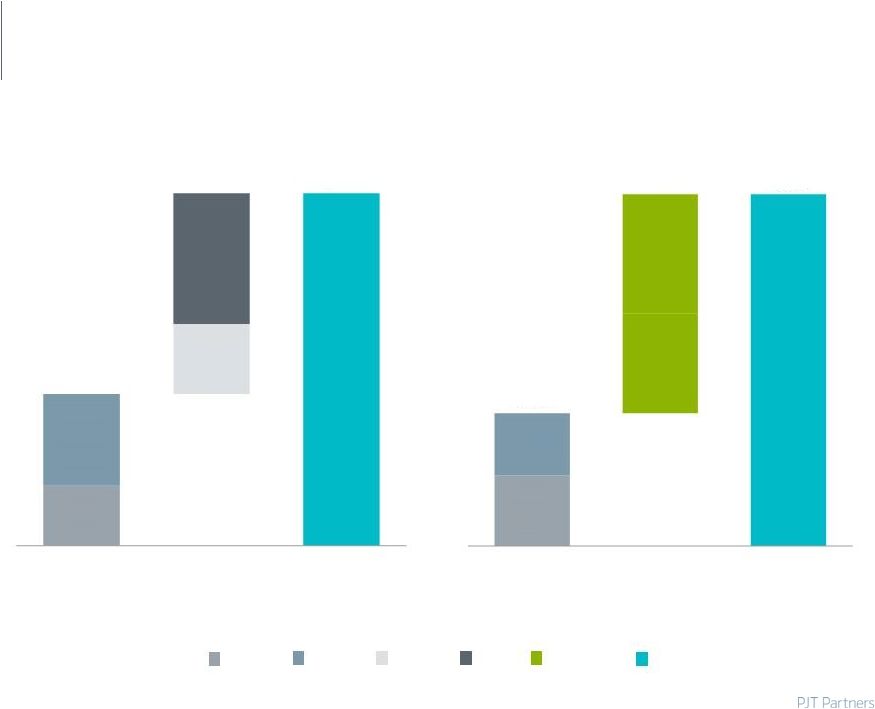
Recent/Projected Financial Performance
HISTORICAL/PROJECTED REVENUE
($ in Millions) Note: Totals may not add due to rounding. 68 105 80 149 $173 $228 $401 1H '14 2H '14 2014 82 72 $155 >$246 >$401 1H '15 2H '15F 2015F + = + = Q1 Q2 Q3 Q4 2H '15 Total 27 |

Non-Compensation Expense
HISTORICAL ADJUSTED NON-COMPENSATION EXPENSE (1) ($ in Millions) Non-Comp/Revenue 21% 18% 17% Note: See appendix for reconciliation of non-GAAP adjustments. (1) Excludes amortization of Blackstone IPO awards of $2.7 million, $2.7 million, $2.8 million and $1.3 million in 2012, 2013, 2014 and 1H '15, respectively. (2) Adjusted to reflect additional expenses of $0.7 million in 2014 and $3.4 million and $1.3 million in 1H '15 related to occupancy and related and
professional fees, respectively. -
(2) (2) 30 5 $73 $68 $73 $35 2012 2013 2014 1H '15 28 |

Compensation Expense HISTORICAL ADJUSTED COMPENSATION EXPENSE (1) ($ in Millions) Comp/Revenue 66% - 65% (2) 63% (2) 226 116 28 10 $235 $258 $254 $126 2012 2013 2014 1H '15 Note: See appendix for reconciliation of non-GAAP adjustments. The adjustments include principally equity-based compensation charges
associated with Blackstones IPO
in 2007 and special equity awards from reissued IPO units. These awards vested from 2007 to 2015, and will be non-recurring after 2015. (2) Adjusted to reflect $27.7 million and $9.6 million of incremental equity-based compensation expense in connection with the spin-off as a
result of a change in vesting period and distributions related to the
Bonus Deferral Plan in 2014 and 1H '15, respectively. (1)
Excludes amortization of Blackstone IPO awards of $83.5 million, $82.0 million, $71.5
million and $23.1 million in 2012, 2013, 2014 and 1H '15, respectively, and
severance of $19.8 million in 2014 and $0.3 million for 1H '15.
29 |

Adjusted Pre-Tax Income
HISTORICAL ADJUSTED PRE-TAX INCOME
($ in Millions) Note: See appendix for reconciliation of non-GAAP adjustments. Totals may not add due to rounding.
(1) Excludes additional expense of $27.7 million related to the change in vesting period
and distributions related to the Bonus Deferral Plan. Margin
13%
19%
18%
(1)
$75
$102
$47
$71
2012
2013
2014
30 |

31 Revenue > Stable despite significant merger dislocations Non-Compensation Expense > Largely Blackstone allocations Compensation Expense Outlook: Focus on Growth in Revenue and Pre-Tax Income > Revenue growth > Similar in aggregate to historical levels Principally Awarded compensation Additionally, GAAP excluding all transaction-related amortization > Accelerating revenue growth > Evidence of operating leverage 2015 2016F 2017F+ Year of Transition Franchise Building Growth through Franchise Building/ Return on Investment > Management Focus: |

Why PJT
Partners 2 3 Differentiated growth strategy Spin-off serves as a catalyst for growth Value creating expansion strategy Global presence and connectivity with less overhead Management highly aligned with shareholders Incentives aligned with increasing shareholder value 1 32 |

Your
Results Are Our Reputation
33 |

Appendix |

Strong
Board Oversight: Broad-based and Relevant Experience
NON-EXECUTIVE BOARD MEMBERS
Name Current & Former Positions Dennis Hersch > Wexner family advisor and L Brands Board member > Former Global Chairman of M&A at J.P. Morgan > Former Partner at Davis Polk & Wardwell Emily Rafferty > Chair, Board of Directors of the Federal Reserve Bank of New York > President Emerita, The Metropolitan Museum of Art Thomas Ryan > Former Chairman and CEO of CVS Health Corporation, formerly known as CVS Caremark Corporation > Serves as a member of the Board of Directors of Yum! Brands and Five Below, Inc. > Former member of the Boards of Directors of Bank of America, Reebok International Ltd., and Vantiv, Inc. Kenneth Whitney > Former Head of the Investor Relations & Business Development Group at Blackstone > Formerly at Coopers & Lybrand, now known as PricewaterhouseCoopers 35 |

PJT
Infrastructure Facilities
Finance Tax Compensation Public company reporting External relations Internal audit Human resources Information technology Legal and compliance FULLY INDEPENDENT PJT INFRASTRUCTURE ONE-TIME START-UP COSTS BEHIND US > Built out new offices (New York, London and Hong Kong) > Closed offices (Frankfurt and Atlanta) > Consolidated Menlo Park office into San Francisco > Global financial reporting systems > Global HR systems > Global IT infrastructure Blackstone Transition Services Agreement (TSA) in place but we intend to primarily use it for tax and compensation
Note: The TSA terms are 24 months, additional services provided as necessary and
termination with 60 day notice. 36 |

GAAP
Statements of Operations ($ in Thousands)
6 Months Ended June 30, Year Ended December 31, 2015 2014 2013 2012 Revenues Advisory Fees $105,266 $271,278 $256,433 $244,439 Placement Fees 48,323 127,664 136,726 106,764 Interest Income 1,530 3,046 2,955 3,809 Other (325) (919) 840 (395) Total Revenues 154,794 401,069 396,954 354,617 Expenses Compensation and Benefits 139,760 317,478 339,778 318,255 Occupancy and Related 14,044 25,601 21,715 22,332 Travel and Related 6,306 13,382 13,678 13,606 Professional Fees 5,966 10,837 12,344 13,713 Communications and Information Services 2,791 7,048 6,772 7,855 Other Expenses 7,055 19,185 16,467 18,047 Total Expenses 175,922 393,531 410,754 393,808 Income (Loss) Before Provision for Taxes (21,128) 7,538 (13,800) (39,191) Provision for Taxes 2,002 3,046 3,373 3,357 Net Income (Loss) Attributable to PJT Partners $(23,130) $4,492 $(17,173) $(42,548) 37 |

6
Months Ended June 30,
Year Ended December 31,
2015 2014 2013 2012 Income (Loss) Before Provision for Taxes $(21,128) $7,538 $(13,800) $(39,191) Adjustments Compensation and Benefits (1) 23,337 91,294 81,981 83,529 Occupancy and Related (2) 3,360 679 - - Professional Fees (2) 1,303 44 - - Communications and Information Services (2) 8 - - - Other Expenses (3) 1,311 2,828 2,653 2,653 Adjusted Pre-Tax Income $8,191 $102,383 $70,834 $46,991 Adjusted Pre-Tax Income RECONCILIATION OF INCOME (LOSS) BEFORE PROVISION FOR TAXES TO ADJUSTED PRE-TAX INCOME
($ in Thousands) (1) This adjustment adds back to Income (Loss) Before Provision for Taxes amounts for Transaction-Related charges, which include principally
equity-based compensation charges associated with Blackstones IPO, special equity awards from reissued IPO units and severance. Severance was $19.8 million for the year ended December 31, 2014 and $0.3 million for the six
months ended June 30, 2015. There were no severance costs related to the
spin-off that were incurred during the years ended December 31, 2013 and 2012. The $19.8 million of severance costs for the year ended December 31, 2014 consists of $14.6 million of cash-based severance payments and $5.2 million of equity-based severance payments.
The cash severance amount is based on Blackstones plan to provide departing employees with 50% of their 2014 total cash compensation amount. The equity amount is based on accelerated vesting of certain equity awards
held by departing employees. The balance of this adjustment relates to
equity-based compensation charges associated with the vesting during the periods presented of awards granted and re-issued in connection with the Blackstone IPO in 2007. These awards have vested or will vest in the period from 2007 through 2015. As these awards represent
payment for prior existing ownership interests, and as the associated
expense is not expected to recur in periods after 2015, we believe that the presentation of a non-GAAP financial measure that excludes the expense associated with their vesting, as well as non-recurring severance costs associated with the spin-off, provides useful insights into the results of
the business in the periods presented. We expect to incur costs for
similar equity-based awards after the spin-off as further discussed in Certain Relationships and Related Party TransactionsAgreements with Blackstone Related to the Spin-OffEmployee
Matters Agreement in the Form 10. We also expect to incur incremental costs for similar equity-based awards to be put in place at the time the spin-off is consummated as
discussed in the Unaudited Pro Forma Combined Statement of Operations in
adjustment (f) in the Form 10. Had these similar plans been in place on January 1, 2014, the incremental expense to the Company, as also noted in pro forma adjustment (f) to the Unaudited Pro Forma Combined Financial Statements, would have been $27.7 million for the year ended
December 31, 2014 and $9.6 million for the six months ended June 30, 2015.
(2) These adjustments add back to Income (Loss) Before Provision for Taxes Transaction-Related charges associated with the spin-off.
(3) This adjustment adds back to Income (Loss) Before Provision for Taxes amounts for the amortization of intangible assets which are associated with
Blackstones IPO. 38 |

GAAP
Reconciliation COMPENSATION EXPENSE
($ in Thousands) NON-COMPENSATION EXPENSE ($ in Thousands) (1) See Footnote 3 on page 38. (2) See Footnote 2 on page 38. 6 Months Ended June 30, Year Ended December 31, 2015 2014 2013 2012 GAAP Compensation Expense $139,760 $317,478 $339,778 $318,255 Amort. of Blackstone IPO Awards (23,060) (71,453) (81,981) (83,529) Severance (277) (19,841) - - Adjusted Compensation Expense $116,423 $226,184 $257,797 $234,726 6 Months Ended June 30, Year Ended December 31, 2015 2014 2013 2012 GAAP Total Expenses $175,922 $393,531 $410,754 $393,808 GAAP Compensation Expense (139,760) (317,478) (339,778) (318,255) Amort. of Blackstone IPO Intangible Assets (1) (1,311) (2,828) (2,653) (2,653) Occupancy and Related (2) (3,360) (679) - - Professional Fees (2) (1,303) (44) - - Communications and Information Services (2) (8) - - - Adjusted Non-Compensation Expense $30,180 $72,502 $68,323 $72,900 39 |